

A Proven Trend Following System with Over 60% Win Rate
A Simple Way to Ride the Trend
In the world of algorithm and quantitative trading, most traders miss the mark to get consistent results. That simple structure will not only provide you a simple structure but provide you with a statistical advantage over the markets.
In a world of flashy indicators and overcomplicated strategies, most traders miss the point: consistency comes from structure, not prediction. That’s where the TripleSync Strategy for S&P 500 stands out.
Tested over 20 years of S&P 500 daily price data, TripleSync delivers disciplined entries, precise exits, and a 62.5% win rate — all wrapped in a system that any serious trader can understand and follow.
Let’s break it down.
How the TripleSync Strategy Works
Core Philosophy
- Capture confirmed trend moves with momentum behind them using SSL as a confirmation and Waddah Attar Explosion for the volume.
- Use two simultaneous trades , one with a tight take profit to get small consistent gains and the other order relying on the exit indicator to close the deal.
- Base all stops and targets on Average True Range.
- Keep risk proportional to account balance — always
The TripleSync Indicators
To ensure high-probability entries, TripleSync waits for two independent indicators to align:
SSL (Period 5) as a confirmation indicator. Buy when the price closes above the SSL and Sell when the price is below the SSL. Here is how it should look like on the chart:
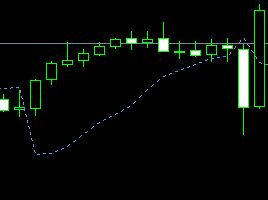
I you can adjust it’s look to whatever you like but I usually really keep it as it is. There is also other versions of that indicators that has two lines crossing over and under the candles. These are the same indicator.
Waddah Attar Explosion (150, 50, 95, 65) as a volume indicator. Only accept signals that aligns a SSL cross and combines a WAE high volume situation. This will confirm that the market is actually on a bigger move and gives you more probabilities to trend.
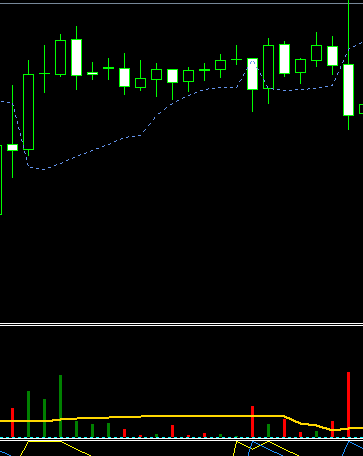
As you can see on the left side of that chart, the green histogram is higher then the yellow/gold line. This is a high bullish volume setup. These backtests have been run with a very specific version of that indicator as there are many of them. If you want to achieve the same results you should use the same indicator. The Waddah Attar Explosion shown in this screenshot is simply a translation of the MACD. In short, it will multiply the difference between the previous and the current distance between the moving averages and provide you with a crystal clear view that there is a divergence between these averages.
Aroon (Period 11) as an exit indicator. Once the trade is running, the cross of the two lines of Aroon will give you a signal that the trend shows signs of exhaustion. Therefore, it is time to exit the market.
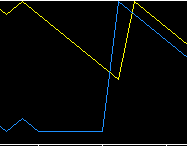
On the example shown above, the Aroon is showing signs that the bullish trend will probably end in the near future.
Only when all three indicators agree does the strategy enter a position — keeping you out of choppy, indecisive markets.
Trade Structure
Each entry signal triggers two trades in a classic structure:
- Trade A: Trend Ride
- Stop Loss = 1.5 × ATR
- No Take Profit — managed with a trailing stop at 1,5x ATR combined with the exit indicator.
- Trade B: Quick Profit
- Stop Loss = 1.5 × ATR
- Take Profit = 1 × ATR
Trade A will ensure that you pick up the big moves in the market while the trade B gives you quick profits that will refill your account of smaller losses you might have taken recently.
Money Management
- Each trade risks 1% of account balance
- Total exposure per signal = 2%
- You need to calculate your risk properly and make sure that each stop losses are equal to 1% of your account balance.
This is a risk percentage that is on the high side but still fine if you are trading your own money. I would recommend going slightly lower if you are trading with a prop firm as they are very strict on the drawdowns.
Backtest Results: S&P 500 Daily Chart (2005–2024)
TripleSync was rigorously backtested on the S&P 500 using daily data and high-precision tick modeling. Here’s what it produced:
| Metric | Result |
|---|---|
| Initial Deposit | $10,000 |
| Net Profit | $2,182.14 |
| Total Trades | 152 |
| Win Rate | 62.5% |
| Profit Factor | 1.83 |
| Max Drawdown | 11.88% |
| Avg. Profit Trade | $50.72 |
| Avg. Loss Trade | -$46.26 |
| Max Consecutive Wins | 18 |
| Max Consecutive Losses | 13 |
Equity Curve Snapshot:

Performance Highlights:
- Smooth, consistent growth over nearly two decades with a significant drawdown on the first 1/3 of the curve. I would assume the 2008 giant crash would be around that time.
- Larger average winning trades than losers
- Controlled drawdowns — never exceeding 12%. That would have meant 6% if you used a 1% risk instead of 2%.
- Handles both bull and bear markets correctly. It shows that it recovers from bad trades quite efficiently.
Why TripleSync Delivers Results
The strength of TripleSync comes from it’s simple structure and execution:
- No guesswork: entries only happen with full confirmation
- No emotional exits: clear trailing stops and a defined exit strategy
- No inconsistent sizing: all risk is based on a fixed % of capital
It’s a strategy that respects volatility, adapts to trend conditions, and executes consistently — the very traits that give systems longevity.
TripleSync in a Diversified Portfolio
Even a strategy with a strong edge can face flat periods or market conditions it doesn’t thrive in. That’s why serious traders don’t rely on one setup — they build systems.
Here’s where TripleSync fits:
- It’s built for daily timeframe trend moves
- Ideal as a core strategy in a trend-following portfolio
- Best when paired with others across uncorrelated assets (Forex, crypto, indices)
By using TripleSync as one of several rules-based systems, you get steadier returns, fewer emotional decisions, and more robust long-term performance.
Final Thoughts
The TripleSync Strategy for S&P 500 is a clean, effective trend system with a proven edge. It prioritizes:
- Confirmations over assumptions
- Structure over prediction
- Consistency over complexity
With over 60% winning trades and profits that outweigh losses, it’s a strategy that doesn’t chase — it waits, confirms, and acts. Clean and simple.
If you are new to quantitative trading I recommend you take a look at our educational content here