

Introduction
In the world of systematic trading, the No-Nonsense Forex (NNFX) methodology stands apart for its empirical rigor and strict rules-based structure. Every component—Baseline, Volume, Confirmation, Exit—must be stress-tested across years of historical data to prove its edge. Indicators must demonstrate statistical merit, not just visual appeal.
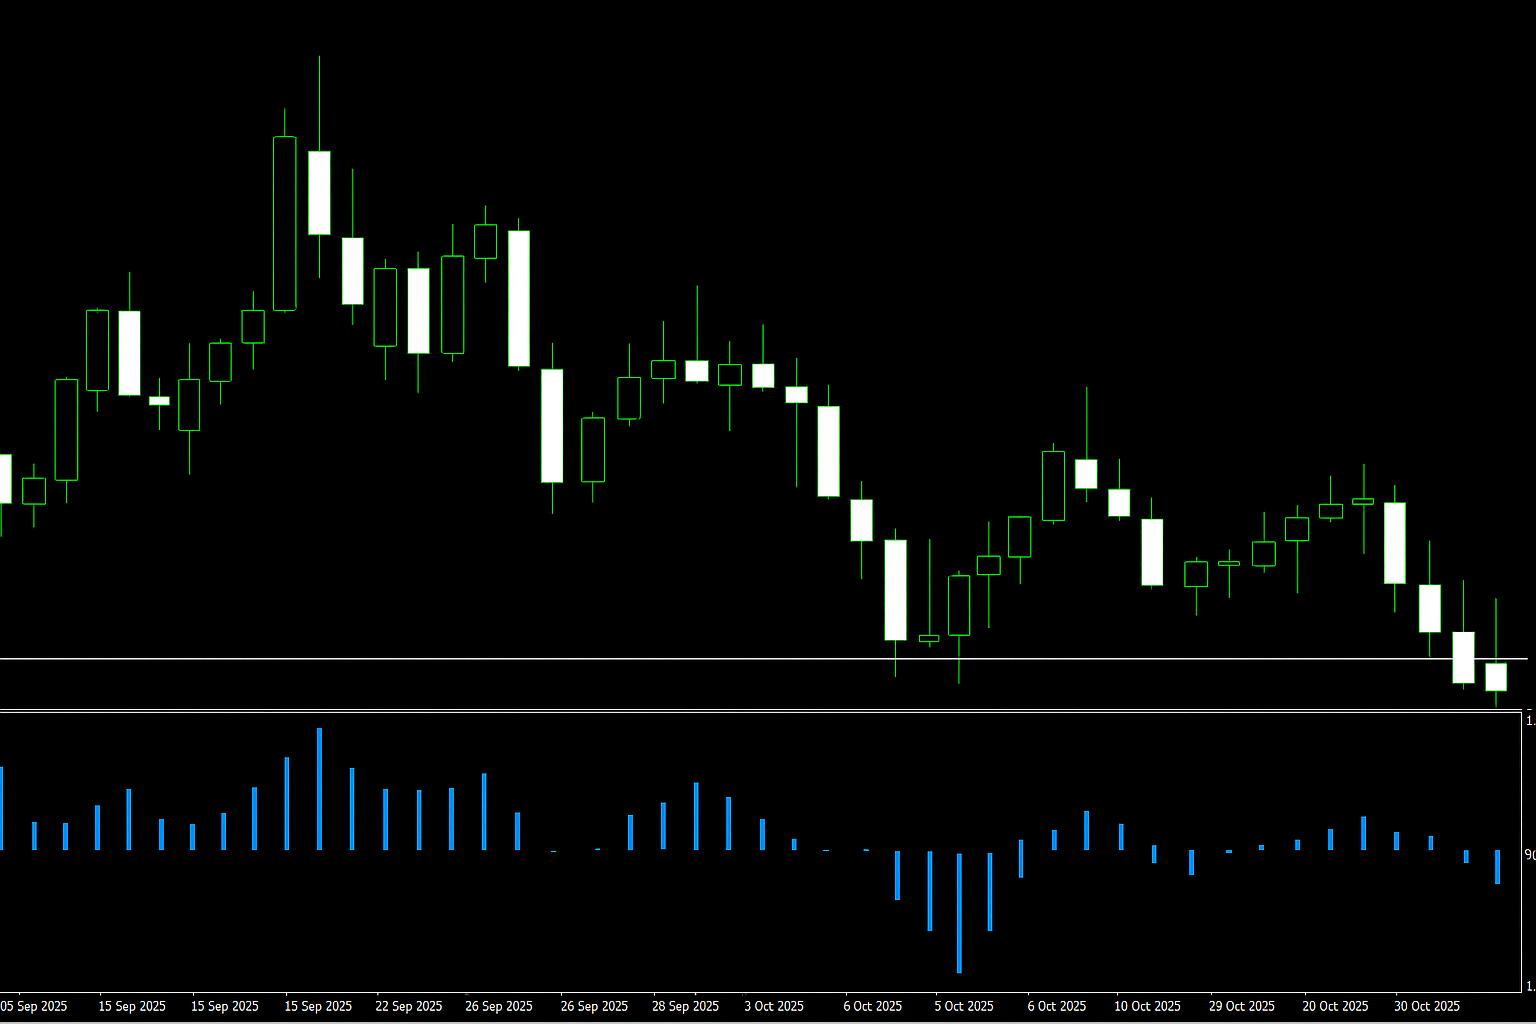
In this test, we evaluated the ADX Directional Movement indicator as the Confirmation 1 (C1) within the NNFX system. Using the default 20-period SMA as the Baseline, 14-period ADX (threshold 25) as the Volume indicator, and Heiken Ashi candles as the Exit strategy, the goal was to assess whether directional movement strength could reliably support trade confirmations.
Backtests were conducted across eight major Forex pairs — EURUSD, EURGBP, AUDNZD, AUDCAD, CHFJPY, GBPJPY, USDCAD, and USDSGD — over a five-year period from January 1st, 2020 to December 31st, 2024 on the Daily (D1) timeframe.
The results reveal how ADX Directional Movement behaves across different market environments — from trending to ranging — and where it may fit within the NNFX framework.
Overall Performance Overview
Key Results Summary:
| KPI | Value |
|---|---|
| Number of Trades | 184 |
| Winning Trades % | 44.44% |
| Average Win Per Trade | $68.70 |
| Average Loss Per Trade | -$47.36 |
| Payoff Ratio | 1.5 |
| Profit Factor | 1.22 |
| Absolute Drawdown | -$220.53 |
| Maximum Drawdown % | 5.16% |
| Trade Expectancy | $29.52 |
| Average Consecutive Loss | 3.5 |
| Maximum Consecutive Loss | 7.13 |
| Total Net Profit | $590.93 |
Interpretation Based on NNFX Standards
Profit Factor (PF = 1.22)
In NNFX methodology, a Profit Factor of 1.30 or above is the benchmark for a viable setup. At 1.22, this test indicates a slightly profitable system at best. The system makes more than it loses, but not by a wide enough margin.
Winning Rate (44.44%) and Payoff Ratio (1.29)
The win rate is within the typical range for NNFX systems (30–45%). However, the payoff ratio falls just above of 1.3, suggesting that even when wins occur, they provide with descent profitability.
Trade Expectancy ($29.52)
Positive expectancy means that each trade, on average, generates profit. However, the number is low, hinting at marginal overall value. Overtrading or weak signal filtering may be diluting edge.
Drawdown (Max 5.16%)
Well within the acceptable <10% risk ceiling imposed by NNFX and many proprietary trading firms. This indicates solid risk control and proper use of ATR-based SL settings.
Loss Sequences (Max 7.13, Avg 3.5)
A max of 7.13 consecutive losses is high and suggests poor performance in choppy or reversing markets. This drawdown streak could psychologically challenge live traders.
Conclusion:
These indicators together define the overall health of the system and its readiness for live use. ADX Directional Movement shows promise, but its reliability and profitability fall short of NNFX deployment standards.
Overall Diagnostic Table
| Category | Evaluation | Comment |
|---|---|---|
| Profitability | Moderate | PF above 1.0, with overall profit |
| Risk Management | Strong | Drawdown below 6% |
| Robustness | Moderate | Mixed results across pairs |
| Signal Reliability | Moderate | Fair win rate, limited payoff ratio |
| Optimization Potential | Moderate | May benefit from tuning or C2 pairing |
NNFX Recommendations
- Retune or replace the C1 indicator → marginal profit factor and low payoff suggest deeper filtering is needed.
- Improve payoff ratio → pair with a sharper C2 to reduce false confirmations.
- Analyze per-pair performance → Some pairs like EURUSD and AUDNZD performed well.
- Compare vs Naked Baseline → If results are similar, the C1 adds little value.
- Consider alternate use → Possibly better as Confirmation 2 or part of a volume hybrid.
Final Assessment
ADX Directional Movement, as a Confirmation 1 indicator, shows partial viability under NNFX rules. It doesn’t fail outright but also doesn’t meet the profitability or consistency benchmarks expected from a robust C1. Its directional strength filtering offers value in trend-following conditions, but may over-trigger in consolidations.
With slight modifications or repositioning into a C2 role, it could become a helpful tool in an NNFX algorithm. Currently, it’s a marginal pass with clear room for improvement.
Pair-by-Pair Analysis
EURUSD
Summary: 16 trades | PF = 1.86 | Win % = 50% | Net = $249.29 | Drawdown = 2.67%
Delivered strong performance with a solid PF and low drawdown. Profitable and stable, showing the indicator works well in this pair’s moderate volatility.
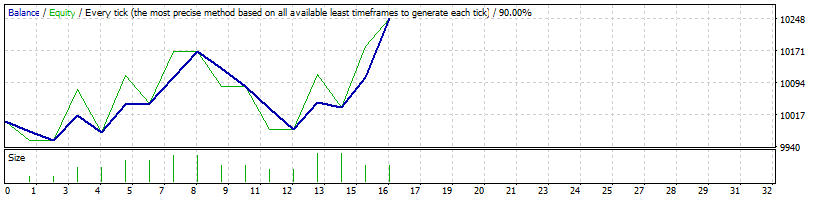
AUDNZD
Summary: 18 trades | PF = 1.84 | Win % = 55.56% | Net = $250.19 | Drawdown = 3.83%
One of the best performers. Balanced accuracy and reward, likely due to clear trends and clean breaks in this cross pair.
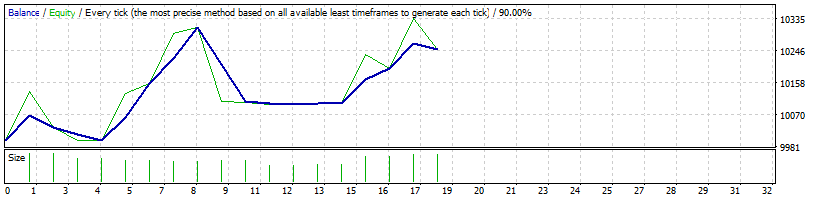
EURGBP
Summary: 24 trades | PF = 1.26 | Win % = 45.83% | Net = $132.14 | Drawdown = 4.77%
Performed moderately. Reasonable results, but lacked the punch of the best performers. Signal frequency may need reducing.
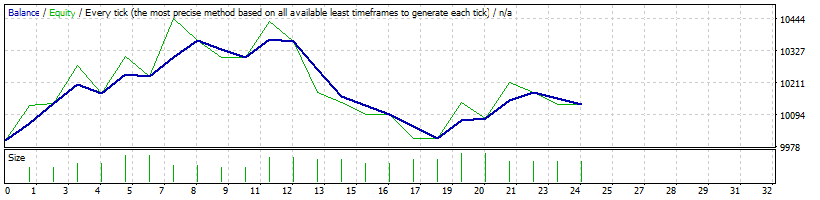
AUDCAD
Summary: 30 trades | PF = 0.81 | Win % = 30% | Net = –$165.41 | Drawdown = 7.01%
Performed poorly. Low win rate and high drawdown suggest this pair doesn’t trend cleanly enough for this C1 to shine.
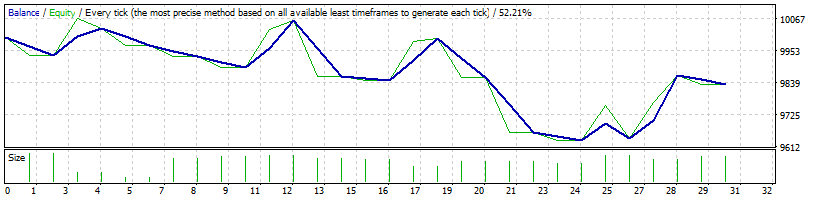
CHFJPY
Summary: 30 trades | PF = 1.08 | Win % = 53.33% | Net = $67.77 | Drawdown = 5.33%
Showed marginal profitability. Moderate drawdown and reliable accuracy, but not a standout performer.
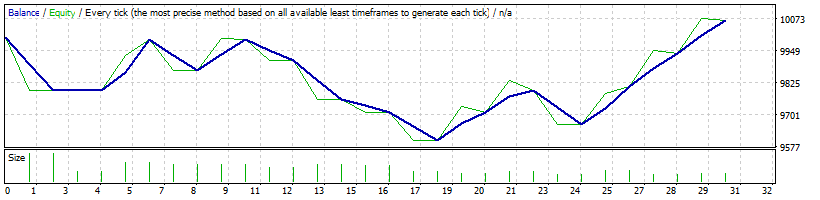
GBPJPY
Summary: 24 trades | PF = 0.81 | Win % = 45.83% | Net = –$95.89 | Drawdown = 5.53%
Another underperformer. Struggled in high-volatility environments, indicating directional momentum was poorly captured.
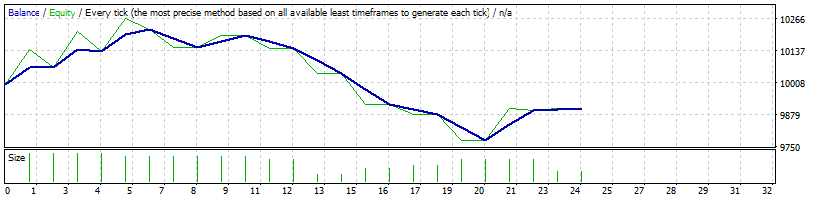
USDCAD
Summary: 14 trades | PF = 0.61 | Win % = 35.71% | Net = –$267.06 | Drawdown = 6.49%
Significantly negative. Weakest metrics in the group, especially poor PF and low win rate.
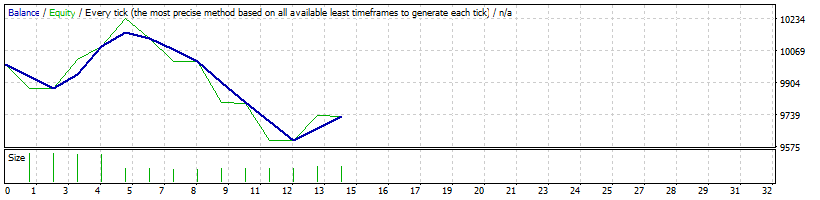
USDSGD
Summary: 28 trades | PF = 1.50 | Win % = 39.29% | Net = $419.78 | Drawdown = 5.63%
Top performer overall. High net profit, solid PF. Shows great synergy with trend confirmation across this pair.
Overall Findings
| Pair | PF | Win % | Net ($) | Verdict |
|---|---|---|---|---|
| AUDCAD | 0.81 | 30.00 | –165.41 | Negative |
| AUDNZD | 1.84 | 55.56 | 250.19 | Strong |
| EURGBP | 1.26 | 45.83 | 132.14 | Moderately Positive |
| EURUSD | 1.86 | 50.00 | 249.29 | Strong |
| CHFJPY | 1.08 | 53.33 | 67.77 | Mildly Positive |
| GBPJPY | 0.81 | 45.83 | –95.89 | Negative |
| USDCAD | 0.61 | 35.71 | –267.06 | Very Weak |
| USDSGD | 1.50 | 39.29 | 419.78 | Strong |
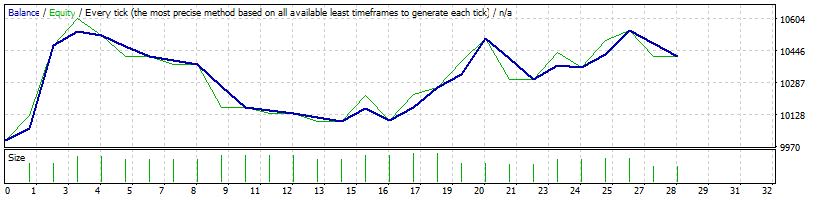
Overall, results show high pair-dependence. Some currency pairs clearly align better with ADX Directional Movement as a C1—particularly USDSGD, AUDNZD, and EURUSD. Others underperform, indicating poor synergy or unreliable signals in choppier environments.
Conclusion
The ADX Directional Movement indicator brings a partial edge as a Confirmation 1 tool. While it demonstrates solid profitability in select pairs, its system-wide performance lacks consistency and fails to meet key NNFX thresholds. Traders may find better results either tuning this indicator further or repositioning it as a Confirmation 2.