
In the NNFX framework
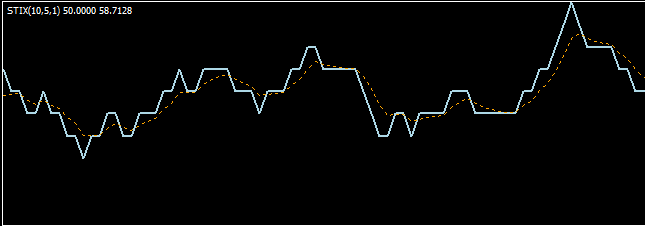
What is the STIX indicator
As I continue this series of tests, I now present you the STIX indicator that I tested as a Confirmation 1 (C1) Indicator.
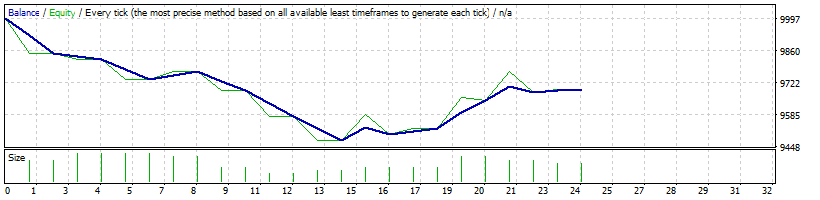
Stix is a two line cross indicator and looks clean with its default color settings. The high number of trades makes it is a relatively fast indicator that means it is possible that it could be used as an exit indicator. Here is what it looks like:
The NNFX Testing Framework
For those who don’t know yet, the first confirmation indicator in a NNFX framework is the main entry signal for a trade. Its goal is to trigger the trades as a new trend forms. However, to have a complete NNFX framework algorithm, you will need to add a second confirmation (which is not part of these tests), a baseline indicator such as the simple moving average, a volume indicator such as the ADX and an exit indicator like Heiken Ashi.
For this series, I will be presenting you a pseudo complete algorithm that can be considered sub par at best. In fact, I will be using the benchmark indicators from the NNFX method. These are SMA period 20 for a baseline, ADX period 14 and threshold 25 for a volume and Heiken Ashi for an exit.
That version of the algorithm also includes the trailing stop, the inverted signal and the one candle rules.
The tests were performed using 8 currency pairs over 5 years of test to provide you with a descent sample size to really give a good idea of the results that indicator gave. I tested it using $10 000 as a start point and 2% risk per trade.
New To The Series?
Discover the series from the beginning. From the methodology, the selection of the sample and the complete rules for each tests. Where the data is shown and the results speak for themselves.

Pair-by-Pair break down
Let’s dig in these results!
USDCAD: Poor Performance, High Loss Rate
- Profit: $-$755,42
- Win Rate: 20%
- Payoff Ratio: 0,55
USDSGD: Mildly Positive but Inconsistent
- Profit: $123,68
- Win Rate: 29,41%
- Payoff Ratio: 2,71
AUDCAD: Consistently Unprofitable
- Profit: -$142,74
- Win Rate: 26,67%
- Payoff Ratio: 2,15
AUDNZD: Moderate Losses, Slightly Better Win Rate
- Profit: -$131,46
- Win Rate: 34,62%
- Payoff Ratio: 1,5
CHFJPY: Heavily Negative with High Drawdown
- Profit: -984,21
- Win Rate: 28,57%
- Payoff Ratio: 0,8
EURGBP: Best Performing Pair
- Profit: 160,88
- Win Rate: 45,24%
- 1,42
EURUSD: Break-Even Outcome
- Profit: $4,5
- Win Rate: 43,75%
- Payoff Ratio: 1,3
GBPJPY: Loss-Making but Some Promise
- Profit: -$303,65
- Win Rate: 41,67%
- Payoff Ratio: 0,71
Overall Insights
The STIX indicator, as a C1 in NNFX rules, shows mixed reliability, with some pairs being borderline usable and others clearly underperforming. Win rates hover mostly under 35%, suggesting a potential issue with signal timing or filtering. This does not mean the indicator is completely useless, this means that it does not fit in that particular algorithm, especially combined with the basic indicators.
Overall Metric Observations
Now that we looked at the metrics for each pair individually, let’s take a look at the data as a whole.
| Number of Trades | Average Profit Per Trade | Average Absolute Drawdown |
| 234 | $$55,96 | -$531,23 |
| Win Rate | Average Loss Per Trade | Maximum Drawdown % |
| 33,74% | -$42,88 | 7,48% |
| Total Net Profit | Payoff Ratio | Average Max Consecutive Loss |
| -$2028,42 | 1,39 | 9,25 |
| Profit Factor | Trade Expectancy ($) | Average Consecutive Loss |
| 0.73 | $18,97 | 4,63 |
From a data standpoint, this indicator is not performing so well in that algorithm’s context. It lost around 20% of the account over 5 years and had a very low payoff ratio. That combined with a massive drawdown and a really big number of consecutive losses makes it non viable as a C1 for that algorithm.
The NNFX system is meant to be a whole and this indicator could maybe find a spot as an exit indicator or even a C2. More tests would have to be conducted in order to find that out.
Essentials Of Trading
If you are building your foundation as a trader, this kind of content comes in handy when your framework is already structured.
In my Essentials Of Trading course, I am offering a solid base and foundation to start a successful trading career. You can start Here:
Conclusion
As a part of any statistical analysis, it is important to mention that even lesser results are part of the process. The indicator is not necessarily bad, it may be just out of its good context.
My take on that indicator is that it is sub par for the NNFX format. If you are looking to build a NNFX algorithm, you might not want spend too much time on that indicator as it proved to give very poor results on a sample size that was adequate. You should invest your attention into a better, more reliable indicator as a C1.