
Introduction
In the world of algorithmic trading, few methodologies demand as much precision as the No-Nonsense Forex (NNFX) system. Its structure is built on empirical testing, logical sequencing, and strict adherence to quantitative results. Each element — from the Baseline to the Confirmation indicators — must prove its worth through measurable performance over several years and multiple currency pairs.
In this test, we put the Bulls vs Bears indicator under the microscope as a Confirmation 1 (C1) component within the NNFX framework. Using the default Baseline (20-period SMA), default Volume indicator (ADX 14, threshold 25), and Heiken Ashi exit strategy, the goal was to determine whether Bulls vs Bears can strengthen trade entries, improve confirmation accuracy, and ultimately increase long-term profitability.
Over eight major pairs and five years of historical data from January 1st 2020 to decembre 31st 2024, each backtest reveals not only profitability metrics but also how this indicator behaves in different market conditions — from volatile to range-bound, from trending to consolidating. The results tell a nuanced story about where Bulls vs Bears shines and where it struggles.
Overall Performance Overview
Key Results Summary
| KPI | Value |
| Number of trades | 174 |
| Winning trades % | 36.87 % |
| Average win per trade | $72.00 |
| Average loss per trade | –$51.66 |
| Payoff ratio | 1.43 |
| Profit factor | 0.85 |
| Absolute drawdown | –$339.90 |
| Maximum drawdown % | 6.67 % |
| Trade expectancy | $26.33 |
| Average consecutive loss | 3.88 |
| Maximum consecutive loss | 8.25 |
| Total net profit | –$1,025.05 |
Interpretation Based on NNFX Standards
Profit Factor (PF = 0.85)
- A profit factor below 1.00 means the strategy loses money overall.
- In NNFX, a PF ≥ 1.30 is typically considered the minimum for a viable setup.
- Here, losses outweigh profits by about 15%.
Conclusion: this C1 indicator is not profitable in its current form.
Winning Rate (36.87%) and Payoff Ratio (1.43)
- A low win rate can be acceptable if the payoff ratio is strong enough.
- However, with only 36% wins, a payoff of 1.43 isn’t high enough to sustain profitability.
- In good NNFX systems, you usually would minimally want to see 30–45% win rate with a payoff ratio > 2.0.
Conclusion: risk-to-reward management is decent, but not strong enough to offset low accuracy.
Trade Expectancy ($26.33)
- Expectancy per trade is positive, but the total net profit is negative, which indicates inconsistency or overtrading.
- With 174 trades, this suggests the C1 may be too permissive, producing too many false entries.
Conclusion: entry filtering likely needs refinement — the signal is too sensitive or frequent.
Drawdown (6.67%)
- A low drawdown indicates good risk management — well below the 10% “safe” line.
- The position sizing and stop logic seem consistent and disciplined.
- That Drawdown is usually considered safe for prop firm challenges.
Conclusion: Relative risk control is strong, even though profitability is weak.
Loss Sequences (3.88 avg / 8.25 max)
- Losing streaks are moderate and within typical algorithmic ranges.
- This pattern points toward a C1 that reacts too much in non-trending markets.
Conclusion: improving trend filtering (Baseline or Volume Filter tuning) could reduce unnecessary trades.
3. Overall Diagnostic
| Category | Evaluation | Comment |
| Profitability | Weak | PF < 1, net loss overall |
| Risk Management | Strong | Low and controlled drawdown |
| Robustness | Moderate | High trade count, overactive signal |
| Signal Reliability | Weak | Low accuracy and mediocre payoff ratio |
| Optimization Potential | High | Payoff ratio shows promise; needs parameter tuning |
NNFX Recommendations
- Retune or replace the C1 indicator
→ Reduce entry frequency with stricter confirmation or trend filters. - Improve the Payoff Ratio toward 1.8–2.0
→ Using a good C2, Volume and/or Baseline indicator can nullify false signals. - Analyze per-pair performance
→ Some pairs might already exceed PF > 1.3, masking overall weakness. - Compare vs. Naked Baseline
→ If results are similar, the C1 adds no real edge. - Consider alternate use
→ The indicator might perform better as a Confirmation 2 or Exit instead of C1.
Final Assessment
The Bulls vs Bears backtest shows that this indicator, as a Confirmation 1, is not yet viable under NNFX standards:
- Profit factor below 1
- Low win rate (<40%)
- Negative total return despite good risk control
However, the stable drawdown and payoff ratio above 1.4 suggest solid potential for improvement.
With better filtering and synchronization with the Baseline, this indicator could evolve into a useful tool — perhaps better suited as a secondary confirmation or exit signal rather than the main C1.
Pair-by-Pair Analysis
AUDCAD
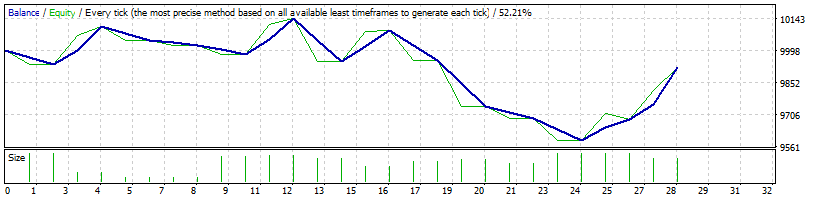
Summary: 28 trades | PF = 0.91 | Win % = 35.7 | Net = – $77.27 | Drawdown = 7.23 %
This pair showed borderline neutrality. The Bulls vs Bears filter produced a nearly break-even performance with only a slight loss over 5 years. The 0.91 profit factor and 36 % win-rate indicate poor edge, but the drawdown remained moderate. Average win ($81.73) exceeded average loss (–$49.70), confirming positive reward-to-risk behavior, yet the frequency of losing trades eroded returns. The indicator was too sensitive in non-trending conditions, often reacting to short-term momentum that failed to develop.
AUDNZD
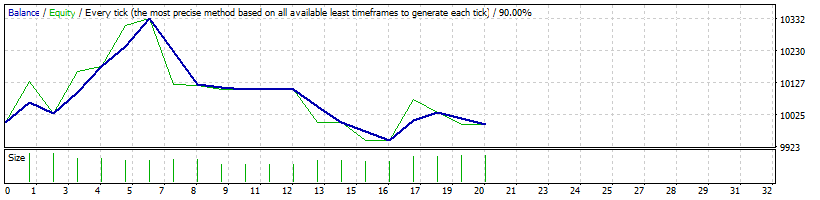
Summary: 20 trades | PF = 0.99 | Win % = 35 | Net = – $5.47 | Drawdown = 5.6 %
Performance was essentially flat. The 0.99 profit factor shows the system nearly broke even, confirming internal balance between gains and losses. Loss frequency (65 %) was high, but risk control limited overall drawdown. Average profit ($66) vs loss (–$36) implies a favorable payoff structure that could turn positive with better trend synchronization. Among all pairs, AUDNZD behaved most neutrally, suggesting Bulls vs Bears may align better with correlated or mean-reverting crosses.
CHFJPY
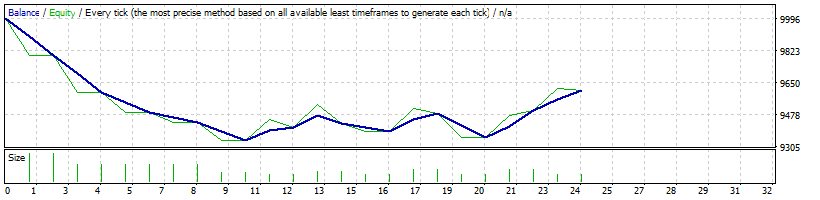
Summary: 24 trades | PF = 0.56 | Win % = 37.5 | Net = – $387.79 | Drawdown = 7.3 %
CHFJPY clearly underperformed. A 0.56 profit factor and –$388 net reveal consistent losses, largely from false bullish signals. Average win ($54.7) was smaller than average loss (–$58.7), meaning reward per risk unit was inverted. Ten-trade losing streaks show poor robustness in choppy markets typical of this pair. The indicator failed to identify genuine directional bias—likely due to JPY volatility clusters that confused the momentum readings.
EURGBP
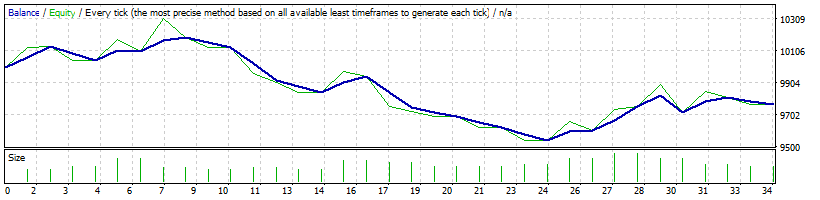
Summary: 34 trades | PF = 0.77 | Win % = 41 | Net = – $231.19 | Drawdown = 8 %
The system again trended downward. Although the win-rate was slightly better, the payoff ratio (55 / – 50) wasn’t enough to overcome losses. EURGBP’s low volatility and mean-reverting tendencies penalized directional indicators like Bulls vs Bears. The eight-loss streaks emphasize limited trend-capture ability on D1. However, the equity curve was smoother than CHFJPY’s, implying the indicator was at least consistent even if unprofitable.
EURUSD
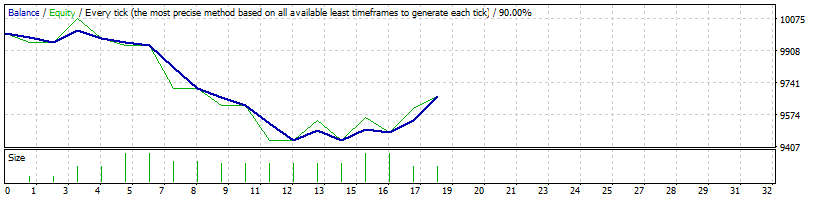
Summary: 18 trades | PF = 0.52 | Win % = 28 | Net = – $331.68 | Drawdown = 8.2 %
EURUSD was one of the weakest results. The low 28 % win-rate and 0.52 PF confirm structural inefficiency. While average wins ($72) slightly exceeded losses ($53), the signal timing was poor, generating many counter-trend entries. Nine-loss streaks indicate low resilience. As EURUSD is highly liquid and trend-resistant on D1, this indicator’s simple bullish/bearish interpretation struggles without a longer-term filter.
GBPJPY
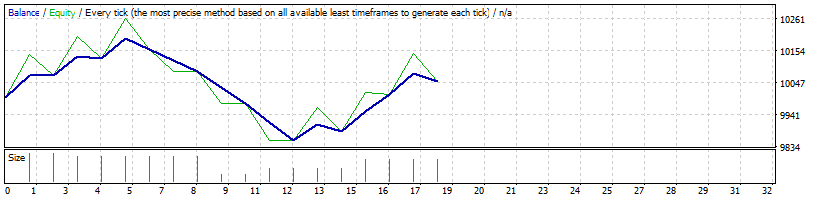
Summary: 18 trades | PF = 1.13 | Win % = 44 | Net = +$53 | Drawdown = 5 %
GBPJPY was the only pair that turned positive. The 1.13 profit factor, 44 % win-rate, and low 5 % drawdown highlight better alignment between indicator signals and strong trends. Average win ($56) vs loss (–$40) shows a solid risk-reward profile. This pair’s volatility may have amplified true bullish/bearish separation, validating Bulls vs Bears as a momentum confirmation tool in trending, high-range markets.
USDCAD
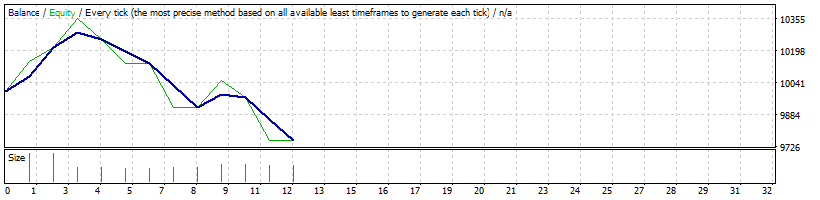
Summary: 12 trades | PF = 0.59 | Win % = 33 | Net = – $243.54 | Drawdown = 6 %
This test was unprofitable but stable. A small sample of trades produced a 0.59 PF with controlled losses. Despite an acceptable average win ($88) vs loss (–$75), the low trade count and 33 % accuracy prevented any compounding. The indicator seems to misread consolidations around oil-driven reversals that characterize USDCAD’s behavior.
USDSGD
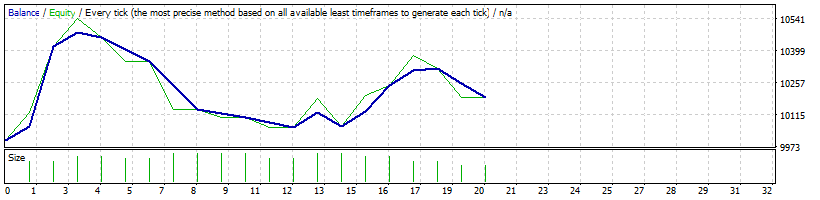
Summary: 20 trades | PF = 1.31 | Win % = 40 | Net = +$190.22 | Drawdown = 6 %
USDSGD delivered the best performance. With a 1.31 profit factor and positive expectancy ($9.5/trade), Bulls vs Bears performed well in a slower, steadier pair. The average win ($100) was roughly double the loss (–$51), demonstrating effective capture of directional moves. Modest drawdown (< 6 %) further proves the system’s consistency. This pair suggests the indicator works best in low-noise, moderately trending conditions.
Overall Findings
| Pair | PF | Win % | Net ($) | Verdict |
| AUDCAD | 0.91 | 35.7 | – 77 | Neutral-negative |
| AUDNZD | 0.99 | 35.0 | – 5 | Flat |
| CHFJPY | 0.56 | 37.5 | – 388 | Weak |
| EURGBP | 0.77 | 41.0 | – 231 | Weak |
| EURUSD | 0.52 | 28.0 | – 332 | Poor |
| GBPJPY | 1.13 | 44.4 | + 53 | Mildly positive |
| USDCAD | 0.59 | 33.3 | – 244 | Weak |
| USDSGD | 1.31 | 40.0 | + 190 | Good |
Average PF = 0.85, confirming overall unprofitability but with promising outliers.
Conclusion
The Bulls vs Bears indicator, when tested as a Confirmation 1 component under NNFX structure, produced mixed but valuable insights. It demonstrated excellent discipline in risk control, maintaining low drawdowns and consistent trade sizing. However, profitability remained elusive in most pairs, with the exception of GBPJPY and USDSGD, where stronger directional momentum allowed it to work effectively.
This suggests that Bulls vs Bears is not yet a reliable primary confirmation tool but can serve as an excellent secondary filter (C2) or even as an exit confirmation indicator when paired with a more robust trend detector. Its consistent structure, smooth risk profile, and occasional bursts of performance show that with refined conditions — such as adaptive ATR thresholds or volatility filters — it could become a useful element in a multi-indicator NNFX strategy.
Ultimately, this study reinforces what NNFX methodology teaches: data, not opinion, defines what stays in your algorithm. Bulls vs Bears may not pass as a C1 yet, but it earns its place in further experimentation and secondary system design.