

Introduction
To officially start this series I have the pleasure to bring you real data and results from a very classic and vastly used indicator for NNFX systems. Since the creator VP has named that indicator in his personal top 100 indicators, it has become very famous among algorithm traders. You can find his website here.
Let’s recap the goal of that series. I want to introduce indicators and demonstrate how good they can really perform in a structured rule based context. That said, the basic “Naked” algorithm composed of a SMA 20 period for a baseline, Heiken Ashi for an exit and ADX as a volume indicator is what we can call a half descent algorithm. You can see it’s very basic results here.
Note that the results presented in this article are with the use of only one of the two required for a full NNFX algorithm to function. That said, this indicator can certainly fit into a different context like an algorithm with a lower time frame, a triple filter one or maybe a reversal one. However, I will only present the results from the former as this is the goal of that series.
I used the very same sample size as well as the same pairs I used for the benchmark article.
What is the SSL Indicator?
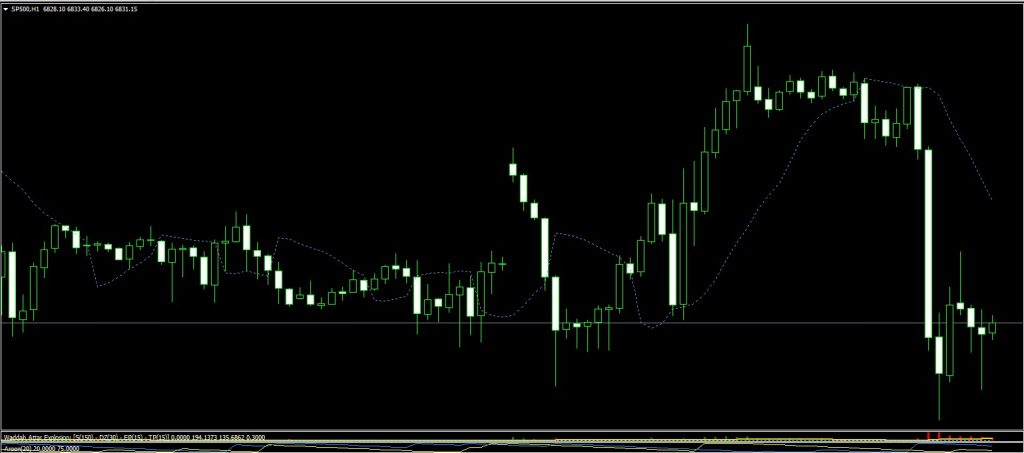
The SSL Channel (Semafor Signal Line) is an overlay on the chart presented either as two lines crossing or a single line version. It works like a moving average crossover, but instead of using price closes, it uses an SMA of the high and low prices. Here is how it looks like:
How I Tested It
System Framework
- Baseline: 20-period SMA
- C1: SSL Indicator (Lb = 10)
- Volume Filter: ADX(14) above 25
- Entry Rules:
- Price must not be more than 1.5× ATR away from baseline.
- SSL must confirm the trend:
- For Buy: SSL crosses below price and shows a new upward trend.
- For Sell: SSL crosses above price and shows a downward trend.
- Baseline and SSL trend must agree.
- ADX must be above threshold.
- Exit Indicator: Heiken Ashi Exit – signals trend reversal to close trades.
- Trailing Stop: Begins at 2× ATR, moves by 0.5× ATR steps, protected with 1.5× ATR offset.
Backtest Details
- Pairs: AUDCAD, AUDNZD, CHFJPY, EURGBP, EURUSD, GBPJPY, USDCAD, USDSGD
- Timeframe: Daily candles
- Period: Jan 1, 2020 to Dec 31, 2024
- Lot Sizing: Risk-adjusted (2% split into 2 trades)
Results Overview
| Strategy Setup | Net Profit | Profit Factor | Payoff Ratio | Win Rate | Max Drawdown | # of Trades |
|---|---|---|---|---|---|---|
| Naked NNFX (No C1 or Exit) | -$5480.28 | 0.67 | 0.74 | 47.46% | 12.98% | 467 |
| SSL as C1 | + $1165,41$ | 3.15 | 2.18 | 51.05% | 4.00% | 114 |
Key Observations:
The SSL is a clear upgrade from the Basic NNFX setup that was a clear loss over time. The profit factor is above 1.3, the payoff ratio is above 2 and the win rate is quite good. That is combined to a max drawdown of 4%. VP was not right, that indicator is wonderful!
Should You Use SSL as Your C1?
Benefits
- Excellent risk/reward performance
- Easy-to-read visual structure
- Enhances trend-following precision
Potential Downsides
- May lag or whipsaw in volatile ranges
- Generates fewer signals — not ideal for scalping
It is important to understand that with a sample size of 114 trades on the backtest, which is only 57 trades with 2 positions taken, there is not enough data to be conclusive about this indicator. I recommend testing it with double that sample before proceeding to the C2 indicator in your setup.
Final Thoughts
While the SSL isn’t perfect, is an awesome indicator in the NNFX system. No wonder it’s so popular in the algorithmic trading community. If you do pick that indicator as your C1, I recommend seeking a slower C2 indicator as this one can be on the fast side of it’s class.