

Introduction
In the universe of algorithmic and quantitative trading, the No-Nonsense Forex (NNFX) method shines through with its systematic edge. At the heart of every NNFX strategy lies the Baseline Indicator—it provides a quick, high-level view of the market’s trend direction.
In this article, I’m excited to present my first baseline indicator test. I used the classic crossover entry rule, combining the Ehler iTrend with the default NNFX Volume Indicator (ADX 14, threshold 25) and the standard Exit Indicator (Heiken Ashi reversal). This test ran from January 1, 2020, to December 31, 2024, across eight major forex pairs: EURUSD, AUDNZD, EURGBP, AUDCAD, CHFJPY, GBPJPY, USDCAD, and USDSGD — all on the daily chart.
The results clearly show that this indicator outperforms the default 20-period SMA baseline. Here’s my full analysis of its performance and potential role in your NNFX system.
Overall Performance Overview (2020–2024)
Key Results Summary
| KPI | Value |
|---|---|
| Number of Trades | 1,102 |
| Winning Trades % | 48.77% |
| Average Win per Trade | $66.70 |
| Average Loss per Trade | -$55.31 |
| Payoff Ratio | 1.21 |
| Profit Factor | 1.16 |
| Absolute Drawdown | -$393.92 |
| Max Drawdown % | 11.79% |
| Trade Expectancy | $32.62 |
| Avg Consecutive Losses | 3.75 |
| Max Consecutive Losses | 10.13 |
| Total Net Profit | $4,484.80 |
Interpretation Based on NNFX Standards
Profit Factor (1.16)
In a complete NNFX algorithm, a Profit Factor below 1.30 is considered weak. While 1.16 is a clear improvement over the SMA 20’s 0.67, this result still falls short of the NNFX threshold for long-term reliability. However, it does indicate consistent profitability.
Win Rate (48.77%) and Payoff Ratio (1.21)
The win rate meets NNFX standards, which typically aim for above 45%. However, the payoff ratio remains low; ideally, we’d see a ratio above 2.0 to handle extended loss streaks. Still, this system lacks a complete exit strategy and confirmation indicators, which would likely improve the payoff ratio.
Trade Expectancy ($32.62)
This is a small but positive figure, meaning the system makes money on average per trade. But with over 1,100 trades and a starting balance of $10,000, this level of expectancy isn’t quite high enough for a professional-grade system.
Drawdown (11.79%)
This is slightly above the 10% prop firm threshold. That said, reducing risk per trade from 2% to 1% would lower the drawdown below 6%, improving funding eligibility and reducing overexposure.
Loss Sequences (3.75 avg / 10.13 max)
A 10-trade losing streak is psychologically and strategically significant. It likely means the system can stay on the wrong side of a pair for up to 10 months, requiring strong discipline or better signal filtering.
Overall Diagnostic Table
| Category | Evaluation | Comment |
|---|---|---|
| Profitability | Moderate | Profit made, but PF < 1.3 |
| Risk Management | Moderate | Drawdown near the critical 10% threshold |
| Robustness | Weak | High trade count and long losing streaks |
| Signal Reliability | Moderate | Solid win rate; payoff ratio underwhelming |
| Optimization Potential | High | Would benefit from a strong C2 and optimized exit |
Final Assessment
The Ehler iTrend offers a significant improvement over the SMA 20 baseline. As a Baseline Indicator, it shows promise—especially when paired with better confirmation tools. While the KPIs are not yet NNFX-grade, this test lacked a Confirmation 1 or Confirmation 2 indicator, and the volume/exit logic was left on default.
Interestingly, the high trade count even on higher settings implies that this indicator could work well in tandem with a slower, more selective confirmation indicator.
Pair-by-Pair Analysis
AUDCAD: Stable performer. PF = 1.07, Win % = 48.77, Net = $282.60, DD = 9.79%. Mildly positive.
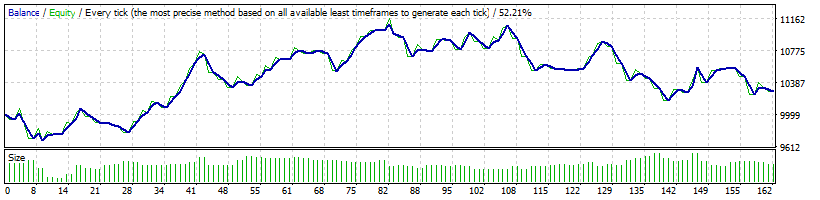
AUDNZD: Top performer. PF = 1.48, Win % = 49.22, Net = $1,489.91, DD = 7.85%. Strong reward-to-risk profile.
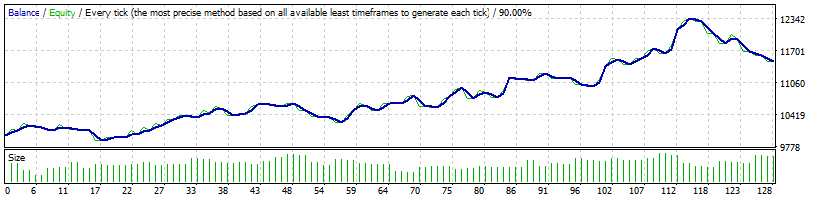
CHFJPY: Marginally profitable. PF = 1.03, Win % = 47.06, Net = $108.13, DD = 10.91%. Needs better entry filtering.
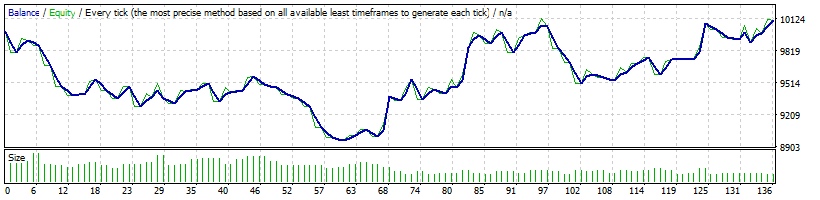
EURGBP: Flat results. PF = 1.02, Win % = 46.88, Net = $92.60, DD = 9.59%. Slightly positive without a confirmation indicator.
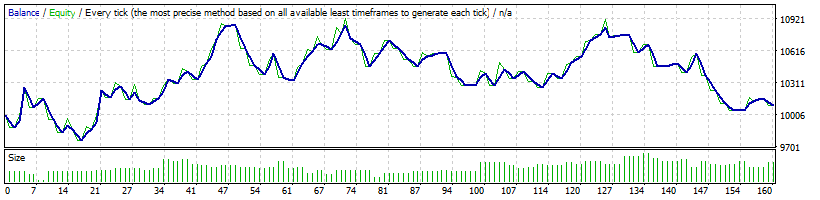
EURUSD: Strong result. PF = 1.25, Win % = 52.46, Net = $954.89, DD = 19.89%. Volatile with many false signals.
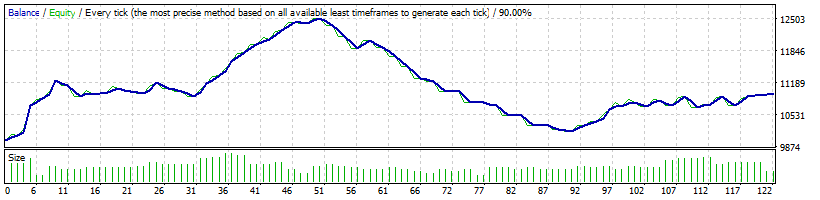
GBPJPY: Volatile but profitable. PF = 1.07, Win % = 49.11, Net = $274.44, DD = 14.47%. Good base for refinement.
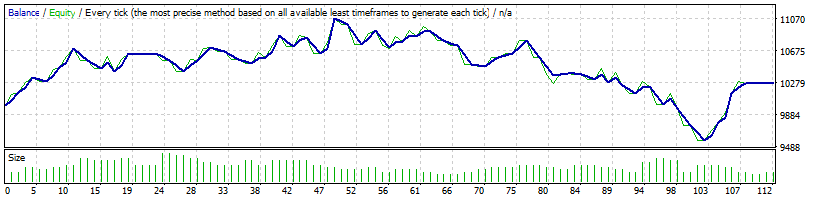
USDCAD: Excellent performance. PF = 1.29, Win % = 49.21, Net = $1,048.74, DD = 11.38%. Nearly ideal profile.
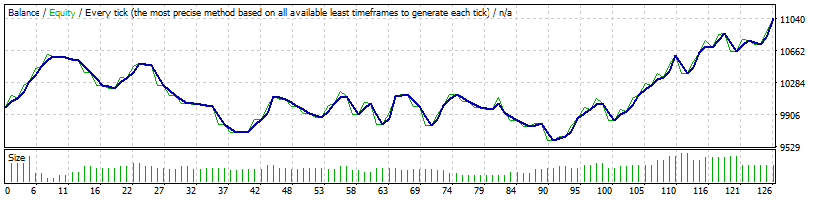
USDSGD: Conservative gains. PF = 1.05, Win % = 47.44, Net = $236.34, DD = 10.46%. Low risk, low reward.
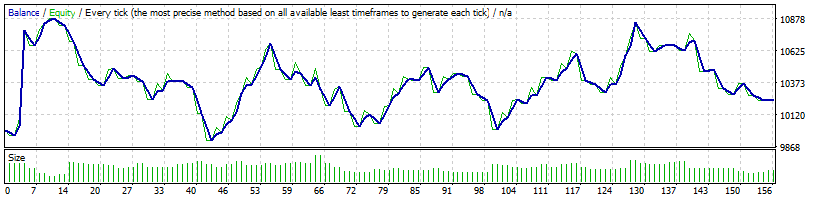
Overall Findings Table
| Pair | PF | Win % | Net ($) | Verdict |
|---|---|---|---|---|
| AUDCAD | 1.07 | 48.77 | 282.60 | Mildly Positive |
| AUDNZD | 1.48 | 49.22 | 1,489.91 | Strong Performer |
| CHFJPY | 1.03 | 47.06 | 108.13 | Marginal |
| EURGBP | 1.02 | 46.88 | 92.60 | Flat |
| EURUSD | 1.25 | 52.46 | 954.89 | Profitable but Volatile |
| GBPJPY | 1.07 | 49.11 | 274.44 | Cautiously Positive |
| USDCAD | 1.29 | 49.21 | 1,048.74 | Almost Viable |
| USDSGD | 1.05 | 47.44 | 236.34 | Safe but Weak |
Conclusion
The Ehler iTrend indicator as a Baseline within a NNFX framework shows considerable promise. Even though the metrics don’t yet hit NNFX perfection, it clearly beats the SMA 20 and performs consistently across multiple pairs.
Take the time to pair it with quality confirmation indicators and a strong exit strategy. You might be surprised by how much this underrated tool can elevate your algorithm.