


Introduction (NNFX Context)
In the No-Nonsense Forex (NNFX) methodology, the Confirmation 1 (C1) indicator plays a decisive role in filtering out false entries generated by the Baseline. It must validate the price direction with reliability, precision, and minimal lag. This week’s analysis explores the Grucha Percentage Index (GPI), tested as a Zero-Line Cross confirmation mechanism on the D1 timeframe. The system used the standard NNFX setup:
- Baseline : 20-period SMA
- Volume : 14-period ADX (> 25 threshold)
- Exit : Heiken Ashi reversal
- Settings: for Grucha Percentage Index Okresy were at 5 as demonstrated by the optimization process
The objective was to determine whether the GPI’s smoothed momentum crossing structure provides consistent trade confirmation across multiple FX pairs while maintaining the strict NNFX standards of profitability, low drawdown, and sustainable expectancy.
Overall Performance Overview
The results of optimization on 1 year gave the impression that this indicator was as good as a zero line cross as it is on a two line cross setting. However, across all pairs tested, the average win rate hovered near 38 %, while the profit factor consolidated around 1.0, producing no significant equity growth despite a moderate sample of 182 trades.
The system achieved an average expectancy of $ 23.95 per trade, yet a total net profit of – $ 686.47, confirming that gains on winning trades were insufficient to offset extended losing streaks.
The average loss per trade (– $ 44.31) exceeded the average win per trade ($ 61.29) only marginally, and the maximum drawdown remained contained (6.37 %), showing that capital protection was acceptable but profits evaporated due to a limited hit rate.
These figures indicate a system that maintained risk control but lacked statistical edge — a hallmark of a neutral or under-optimized C1 component.
Interpretation Based on NNFX Standards
In NNFX evaluation criteria, a Confirmation 1 indicator must:
- Improve win consistency over the Baseline alone.
- Enhance the Profit Factor (> 1.3 ideal).
- Maintain drawdown under 10 %.
- Exhibit stable performance across uncorrelated pairs.
The Grucha Percentage Index met the drawdown requirement on most pairs but failed the Profit Factor and Consistency standards.
Pairs such as USDSGD and AUDNZD posted strong profitability (Profit Factor > 1.2 – 2.8)USDSGD and AUDNZD, yet others like EURUSD, EURGBP, and CHFJPY collapsed below 0.7.
The dispersion of outcomes underscores that the GPI’s Zero-Line cross captures isolated trend bursts but struggles to adapt to varied volatility regimes.
Overall Diagnostic Table
| Metric | Value | Interpretation |
|---|---|---|
| Total Trades | 182 | Adequate sample size |
| Win Rate | 37.76 % | Below NNFX target (> 48 %) |
| Profit Factor | 1.00 | Neutral – no edge |
| Max Drawdown | 6.37 % | Acceptable risk |
| Expectancy | $ 23.95 | Marginal positive value |
| Payoff Ratio | 1.48 | Favorable R:R but low hit rate |
| Consecutive Losses (Max) | 7 | Streak-prone behavior |
NNFX Recommendations
- Do not use GPI (ZLC) as a standalone C1. Its neutrality indicates no consistent confirmation advantage. I would recommend using it as a two line cross instead as the results were fantastic!
- Potential improvement: test with higher smoothing parameters (Okresy ≥ 10) to mitigate noise.
- Alternative role: consider GPI as a secondary “momentum filter” paired with a faster C1 (e.g., RSI Crossover or Fisher Transform) to strengthen directional confidence.
- Baseline alignment: its delayed zero-cross makes it more reactive than predictive — acceptable for exit filters, not for entry validation.
Final Assessment
While visually appealing and mathematically elegant, the Grucha Percentage Index (ZLC) lacks the robustness required of a first-tier NNFX confirmation indicator.
Its profit factor ≈ 1.0 and sub-40 % win rate render it statistically indistinguishable from random expectancy when risk is normalized.
However, its low drawdown, controlled volatility, and clean cross structure suggest potential in composite systems or algorithmic filters where confirmation relies on confluence rather than singular signals.
Pair-by-Pair Analysis
AUDCAD
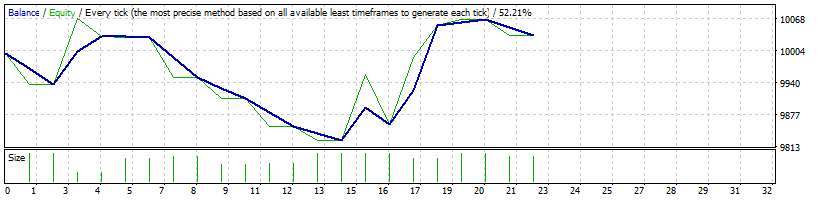
A balanced outcome with Profit Factor 1.10, Net Profit $ 34.20, and Drawdown 5.18 %AUDCAD. Performance was stable but lacked thrust. The average win doubled the loss ( $ 53 vs $ 22 ), yet the 68 % loss ratio neutralized results. Conservative but uninspiring.
AUDNZD
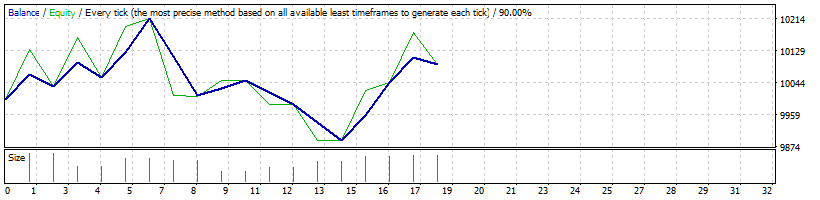
Delivered Profit Factor 1.21 and Net Profit $ 94.21AUDNZD. Half of trades were winners, and expectancy reached $ 5.23. The GPI’s responsiveness to medium-term swings in AUD pairs makes it one of the few bright spots in the test set.
CHFJPY
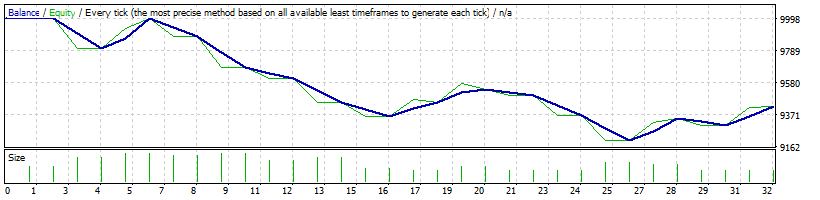
One of the weakest pairs, with Profit Factor 0.53, Net Loss $ – 573.22, and a heavy 9.41 % drawdownCHFJPY. Extended losing streaks ( 10 losses in a row ) indicate sensitivity to JPY volatility spikes and trend whipsaws.
EURGBP
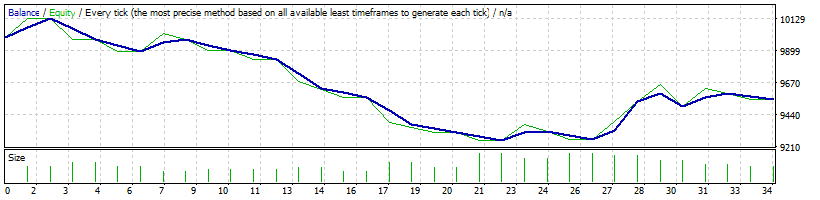
Also underperformed: Profit Factor 0.61, Net Loss $ – 447.51, and Drawdown 9.82 %EURGBP. The indicator consistently misread sideways markets, showing a 32 % win rate. Most losses clustered in long positions against dominant GBP momentum.
EURUSD
The worst result overall with Profit Factor 0.32, Net Loss $ – 383.19, and only 18.75 % winning tradesEURUSD. The GPI’s lagging confirmation proved fatal in ranging conditions, missing key trend entries and triggering early losses.
GBPJPY
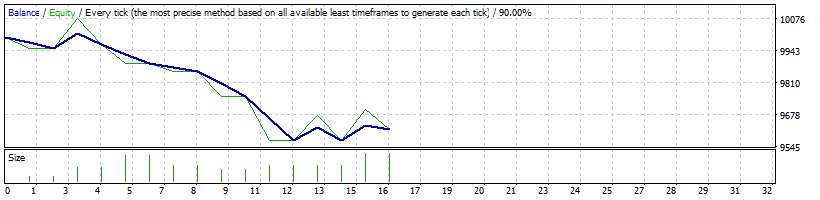
Produced Profit Factor 0.83 and Net Loss $ – 84.96, but maintained drawdown under 6 %GBPJPY. While loss-biased, average profit trades remained solid ($ 51 vs $ 41 loss), suggesting that trend entries were sound but rare.
USDCAD
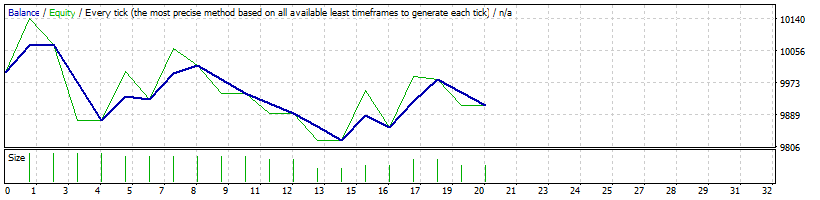
Moderately negative with Profit Factor 0.65, Net Loss $ – 153.25, and drawdown 4 %USDCAD. Most damage came from false bearish signals during range compression. Momentum divergence lagged price, reducing accuracy.
USDSGD
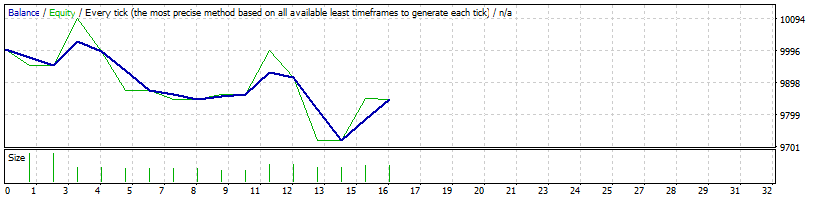
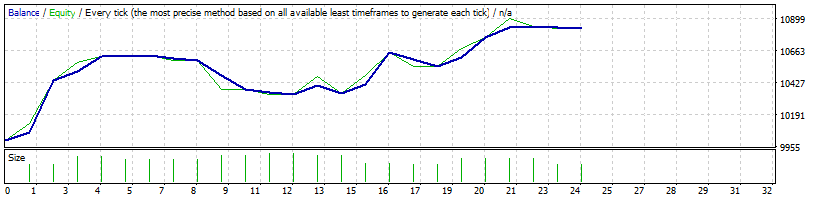
The stand-out performer with Profit Factor 2.80, Net Profit $ 827.25, and drawdown 4.3 %USDSGD. Over 54 % win rate and average profit nearly 2.4× average loss show the GPI thrives in stable, directional markets like SGD-based pairs.
Overall Findings Table
| Pair | Profit Factor | Win % | Net Profit ($) | Max DD % | Comment |
|---|---|---|---|---|---|
| USDSGD | 2.80 | 54 | 827.25 | 4.3 | Best performer; trending stability |
| AUDNZD | 1.21 | 50 | 94.21 | 4.9 | Moderate success |
| AUDCAD | 1.10 | 31 | 34.20 | 5.2 | Near neutral |
| GBPJPY | 0.83 | 40 | – 84.96 | 5.3 | Mildly negative |
| USDCAD | 0.65 | 37 | – 153.25 | 4.1 | Weak bearish bias |
| EURUSD | 0.32 | 19 | – 383.19 | 6.8 | Unusable as C1 |
| EURGBP | 0.61 | 32 | – 447.51 | 9.8 | High drawdown |
| CHFJPY | 0.53 | 38 | – 573.22 | 9.4 | Volatility fragile |
Conclusion
The Grucha Percentage Index (Zero Line Cross) offers visual elegance and a smooth analytical structure but falls short of NNFX profitability benchmarks when used as a primary Confirmation 1 indicator.
Its performance varies drastically across pairs — showing potential in stable currencies like SGD but weakness in volatile or range-bound pairs such as EURUSD and CHFJPY.
While its drawdown profile remains contained, the lack of consistent edge renders it better suited as a secondary momentum filter or hybrid component in multi-indicator systems rather than a standalone NNFX C1 tool.